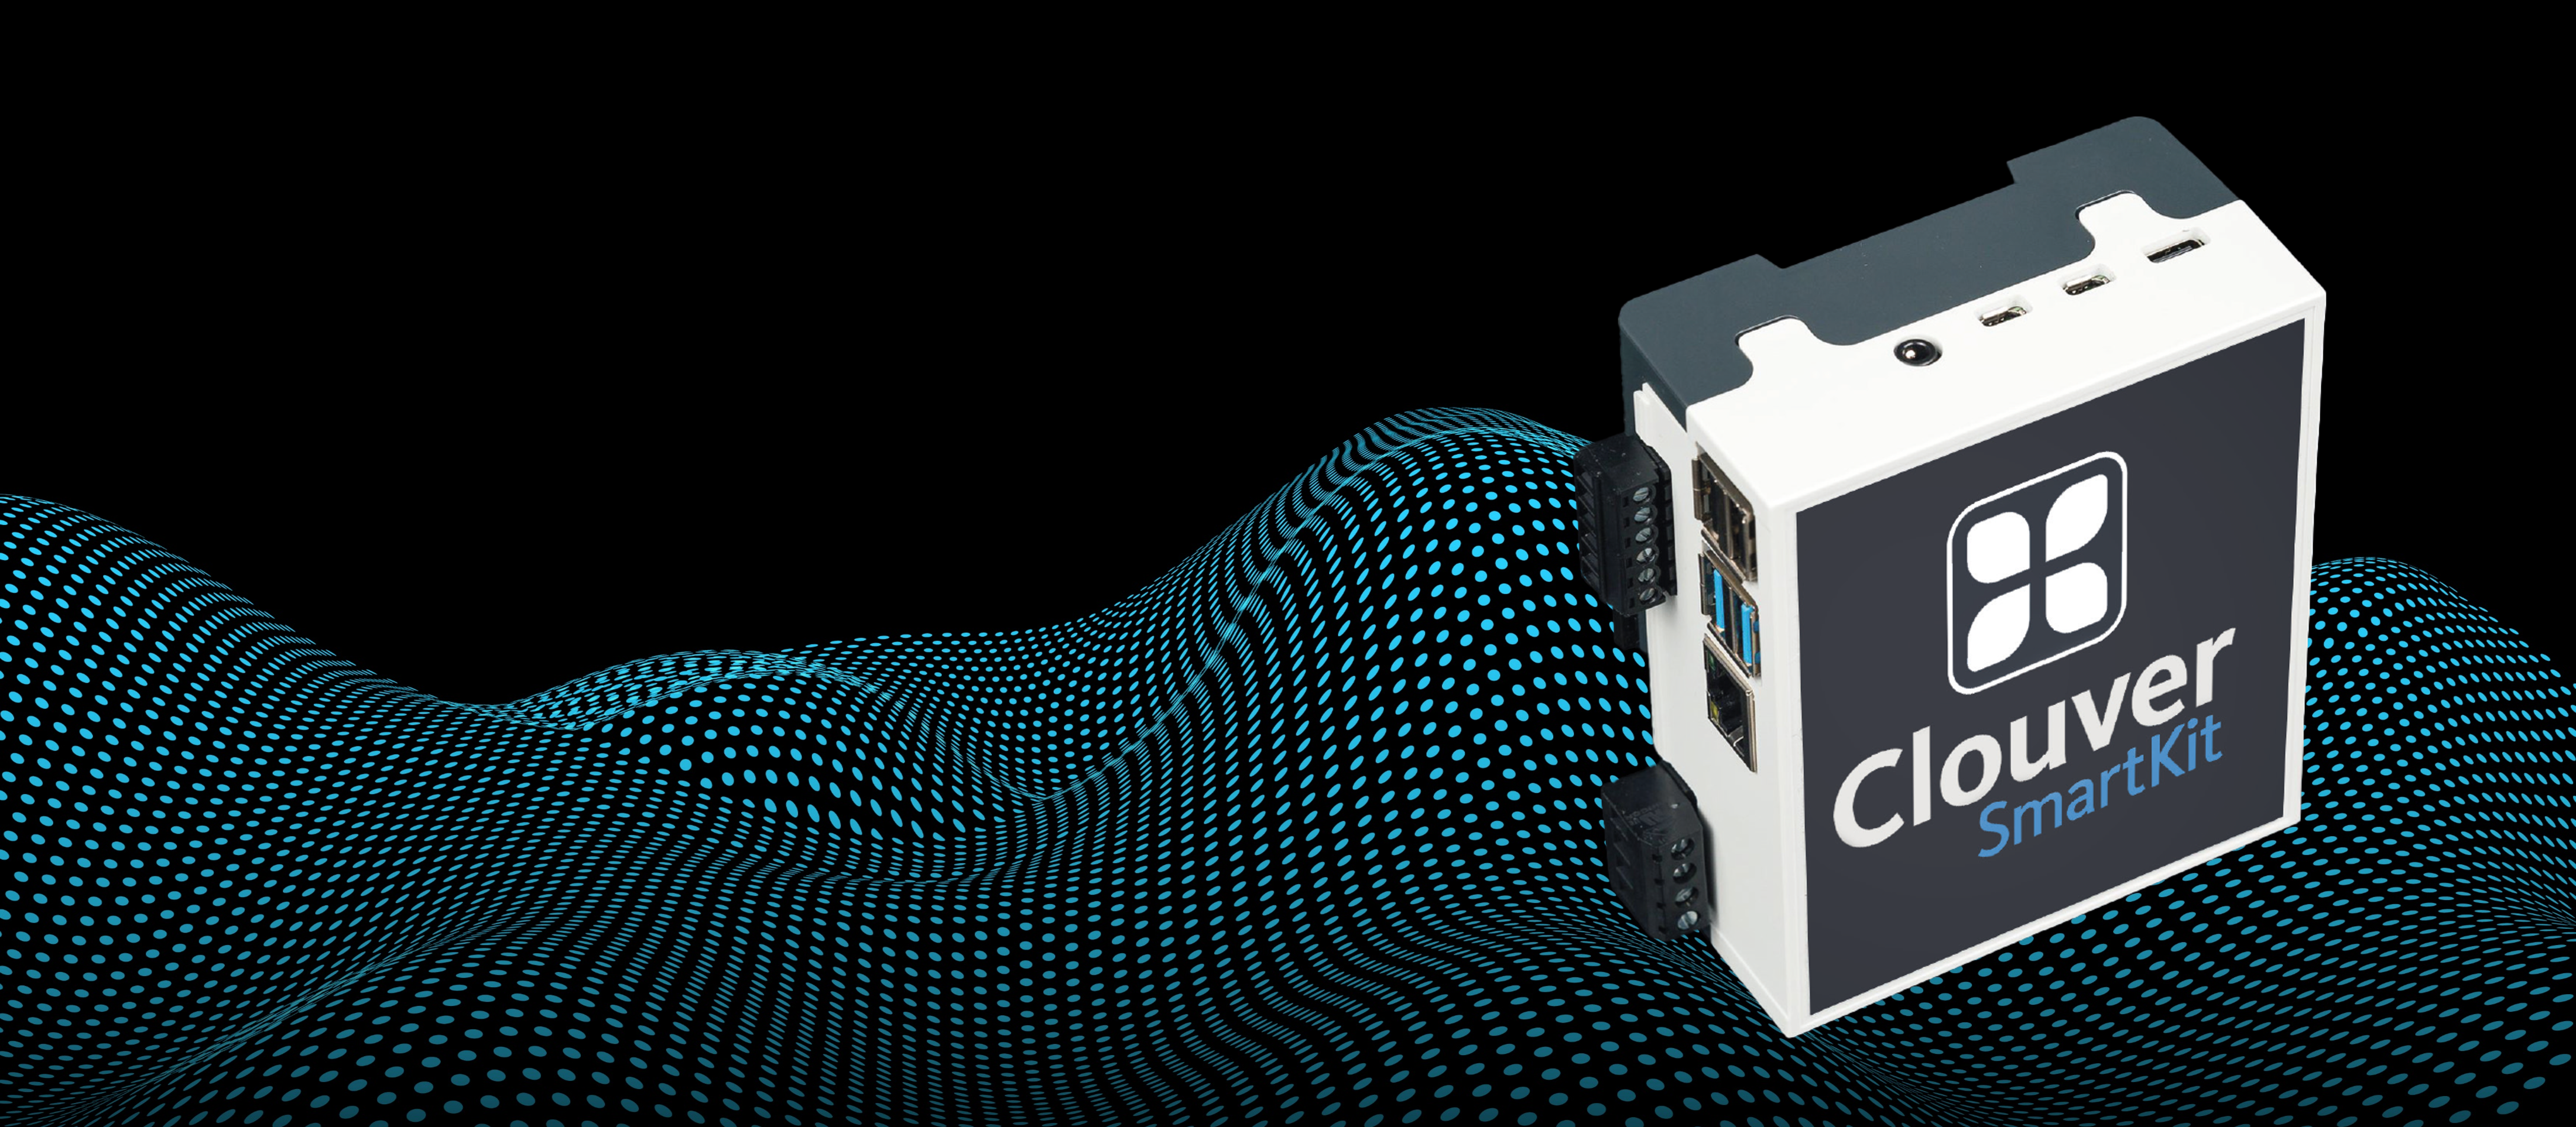
Countless Machine Types, One Solution to Connect Them All
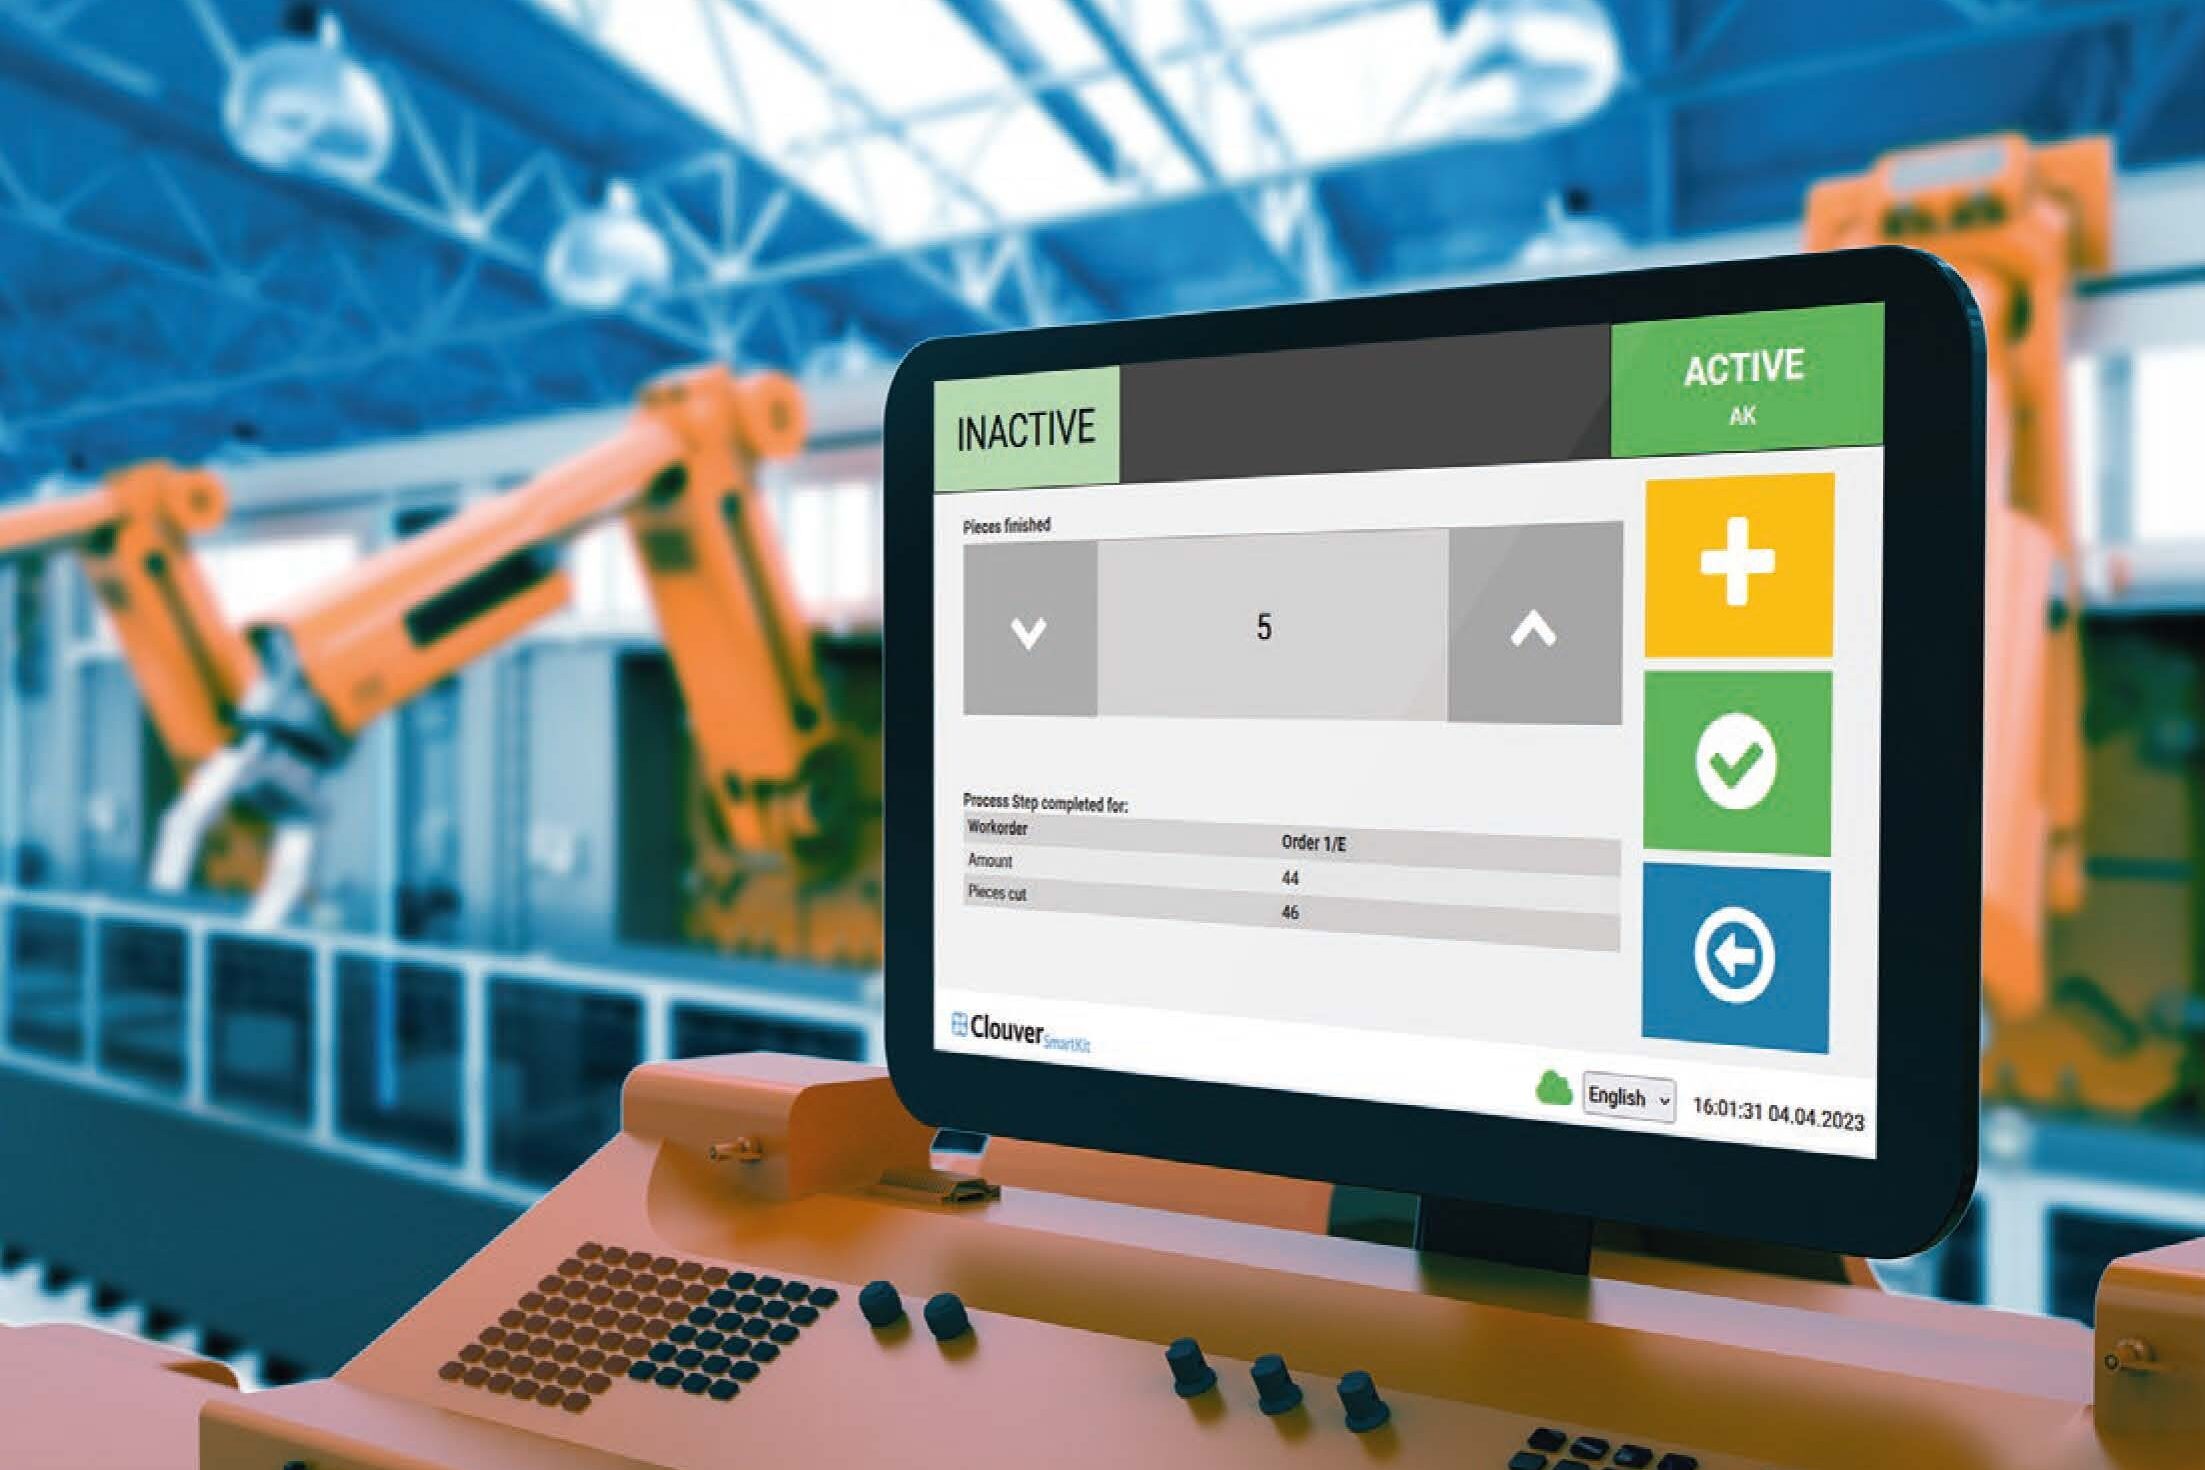
With Clouver SmartKit, you achieve limitless connectivity: you can connect any type of your machines and visualise the production data of every process. Installation is typically completed in less than an hour and can be easily and swiftly carried out by your company's electrician. If assistance is needed, our experts at ProCom Automation are always ready to help.
Your Advantages With SmartKit
- Connection of any electronic machines in your production line – including old machines
- Safe and fast installation in the machine control cabinet by your on-site electrician (potentially with remote support)
- No interference with machine technology and electronics – you still retain your existing machine warranties
- Galvanic separation of power supply and data lines
- Integration with a variety of interfaces (MQTT, OPC UA, EtherCAT, CC-Link, Profibus, and more)

Easy or Flex - The Choice is Yours
From the two options, choose the SmartKit that suits you best:
SmartKit Easy
- Contactless condition monitoring
- Energy monitoring
- AC current transformer included
- Easy installation
- Perfect entry-level product
SmartKit Flex
- Capture extensive machine states
- Utilise machine interfaces
- Modularly expandable
- Analog and digital inputs
- Integration with industrial networks
DOWNLOADS

This might also be of interest to you


Sergej Gigel
Senior Sales manager
More Information? Reach Out to Us!
Learn more about our products, services, and potential collaboration. Simply get in touch with us by phone or email. I look forward to a personal exchange!
- Phone: +49 241 93681-500
- Email: contact@procom-automation.de